Asset views
Asset views are temporal views to analyze detailed results and parameters by asset.
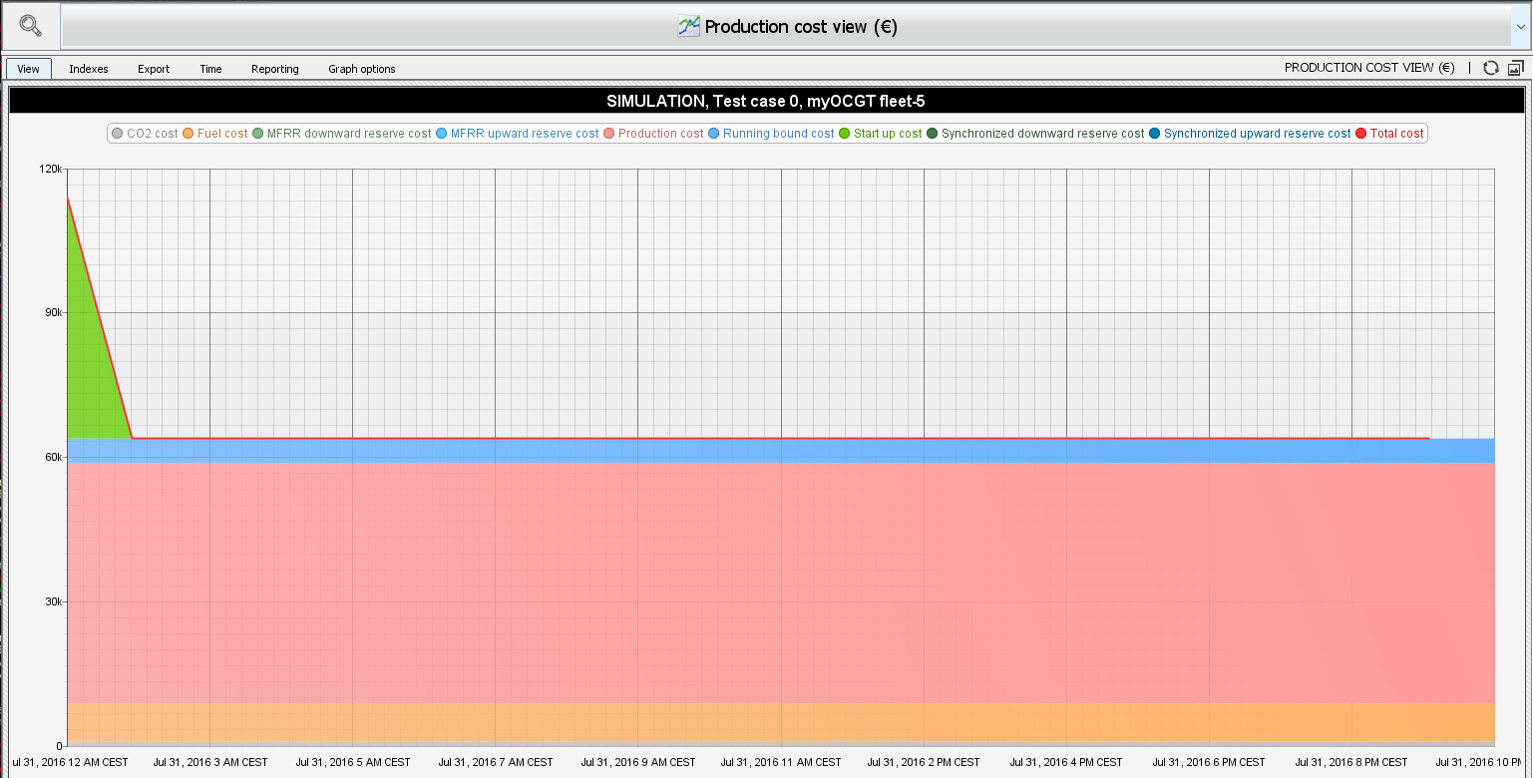
Exemple of asset view showing the asset costs at all time
They can be accessed from the default asset view. This view is opened by double-clicking on each asset on the map with the Assets decorator.

How to access asset views
Note that some views are limited to specific and compatible technologies. (An asset view about storage will be available only for asset with storage capacity eg.)
Consumption view (Fuel)
- Indexed by
- scope
- test case
- asset
- data
This view shows the fuel consumption of the asset, in W. It considers whether fleet mode and cluster mode, and displays the appropriate results.
- Stacks:
- (Cluster mode only) Fuel consumption from energy making
- (Cluster mode only) Fuel consumption from running capacity
- Lines:
- Fuel consumption
- Absolute minimal fuel consumption (0 in cluster mode, as the running capaciy has no lower boundary)
- Absolute maximal fuel consumption calculated from installed capacity
- Absolute maximal fuel consumption calculated from available capacity
Consumption view (Gas)
- Indexed by
- scope
- test case
- asset
- data
This view shows a time series of the gas consumption of the asset
Consumption vs production view
- Indexed by
- scope
- test case
- asset
- data
This view shows a time series of the electricity production and consumption of the selected asset, as well as the running capacity.
Contract view
- Indexed by
- scope
- test case
- asset
This view shows the result of the financial asset, as a time series
Production cost view
- Indexed by
- scope
- test case
- asset
- data
This view shows the time series of the production cost of the selected asset, as a stacked chart that cumulates the following costs: - CO2 emission cost - Consumption cost - Fuel consumption cost - MFFR downward reserve cost - MFFR up not running cost - MFFR upward reserve cost - Production cost - Running cost - Start up cost - Storage cost - Synchronized downward reserve cost - Synchronized upward reserve cost
Production view (Gas)
- Indexed by
- scope
- test case
- asset
- data
This view shows a time series of the gas production of the asset as well as levels of minimal generation and available capacity.
Production view
- Indexed by
- scope
- test case
- asset
- data
This view shows a combination of time series as stacks and lines
- Stacks:
- Non reserved generation
- Downward MFRR
- Downward Synchronized Reserve
- Upward Synchronized Reserve
- Upward MFRR
- Lines:
- Generation capacity
- Available capacity
- Running Bound
- Generation level
- Minimal Generation level
Storage view
- Indexed by
- scope
- test case
- asset
- data
This view shows a combination of time series as stacks and lines
- Stacks:
- Production
- Fixed demand
- Consumption
- Fixed supply
- Bounded supply
- Lines:
- Maximum storage capacity
- Available storage capacity
- Storage level
- Minimal storage level
Transmission consumption view
- Indexed by
- scope
- test case
- asset
- data
This view shows a time series of the consumption of the selected transmission asset as well as the available consumption capacity
Transmission production view
- Indexed by
- scope
- test case
- asset
- data
This view shows a time series of the generation of the selected transmission asset as well as the available production capacity