Delivery Points indicators
Delivery Point views -also called Delivery Point indicators- are delivery points-centered indicators which enable you to analyse or compare one or several delivery points from a same context. Delivery point views are often temporal, and more detailed than their KPI equivalent when there is one. NB: Most of them need computation results and will show no data until results are available.
These views can be opened by double-clicking on a delivery point, then clicking on the view name at the top and finally selecting the wanted view.
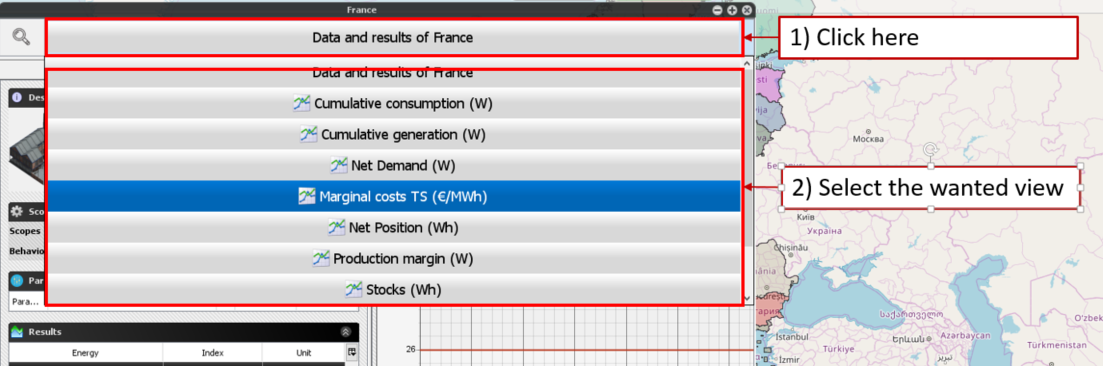
Click there to access delivery point views
Demand pie chart
This view shows, for each energy, a pie chart showing how the demand is divided by demand type at this delivery point. The demand here includes the flexible demand after optimization and non-flexible demand.
Supply pie chart
This view shows, for each energy, a pie chart of the different supply types in the context, with their proportions.
Cumulative demand
This view shows, for each energy, a temporal cumulative view showing how the energy demand is divided by technology at this delivery point. The demands are here shown after optimization (using the consumption of the corresponding assets). For asset “Electric Vehicles” with behavior Vehicule to grid, the demand is the difference between consumption and generation of the vehicles.
Cumulative generation
This view shows a temporal cumulative view, for each energy, of the generation at the selected delivery point for each generation technology at every time step as well at the demand level.
Demand and Net Demand
This view shows time series, for each energy, of the demand and net demand, both optimized and unoptimized, for this energy at the selected delivery point. Unoptimized net demand is defined as the difference between unoptimized demand and the must run available capacity. Optimized net demand is defined as the difference between optimized demand and the must run generation.
Marginal Costs TS
This view shows a time series, for each energy, of the marginal cost of generation of this energy at the selected delivery point.
Net Position
- Indexed by
- scope
- delivery point
- energy
- test case
- time
This view shows a time series of the hourly balanced volume of energy (volume of energy exported minus the hourly volume of energy imported), for a selected delivery point.
Production margin
Margin at each time step between available capacity and energy production for a given delivery point, for a given energy and a given technology: