Decorators
Decorators are indicators which can be visualized on the map. They include “KPI decorators” (results from the KPI views, see “KPI documentation” for more information), but also some additionnal map-oriented views, which are documented below.
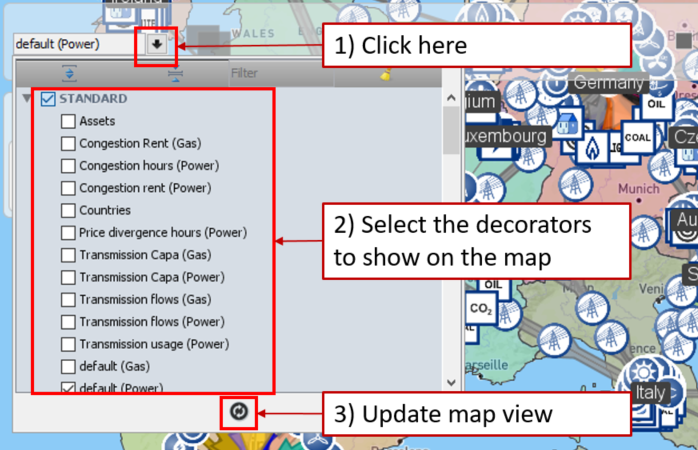
Click there to access decorators
This view enables you to configure the decorators
Assets
This view shows all the assets of the context, physical and financial, linked to the relevant delivery point(s). A small arrow is present in every link between asset and delivery point to indicate the direction of the main flow.
Congestion hours (Power)
This view shows the amount of hours during which the interconnector was congested, in both directions. There is one arrow per direction whose size is related to its congestion time.
Congestion Rent (Gas)
This view shows the congestion rent of each gas interconnector, for both directions. There is one arrow per direction whose size is related to its congestion rent.
Congestion rent (Power)
This view shows the congestion rent of each power interconnector, for both directions. There is one arrow per direction whose size is related to its congestion rent.
Countries
This view shows the zones of the context, without showing the different assets
default (Gas)
This view shows all the assets of the context, physical and financial, related to the gas market. It also shows an arrow that is showing the flow between the assets and the relavant delivery point(s)
default (Power)
This view shows all the assets of the context, physical and financial, related to the power market. It also shows an arrow that is showing the flow between the assets and the relevant delivery point(s)
Price divergence hours (Power)
This view shows, in hours and for each interconnector, the amount of time during which the marginal price for generating electricity in the input country is higher by more than 1€/MWh then the one in the output country. There is one arrow per direction whose size is related to its amount of price divergence hours as defined.
Transmission Capa (Gas)
This view shows, for each gas interconnection and each direction, the corresponding transmission capacity. There is one arrow per direction whose size is related to the transmission capacity.
Transmission Capa (Power)
This view shows, for each power interconnection and each direction, the corresponding transmission capacity. There is one arrow per direction whose size is related to the transmission capacity.
Transmission flows (Gas)
This view shows, for each gas interconnection and each direction, the corresponding total flow during the length of the context. There is one arrow per direction whose size is related to the total flow in that direction.
Transmission flows (Power)
This view shows, for each power interconnection and each direction, the corresponding total flow during the length of the context. There is one arrow per direction whose size is related to the total flow in that direction.
Transmission usage (Power)
This view shows, for each power interconnection and each direction, the total usage define by the total flow during the length of the context divided by the maximum theoretical flow. There is one arrow per direction whose size is related to the total usage.